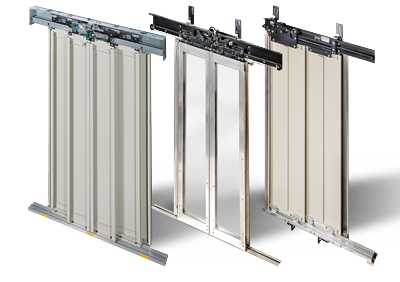
 自1977年来,威特就开始为电梯行业提供多功能、高品质的轿厢门。设计灵活,加上通过了一系列认证,使威特层门能够适应各种应用。有多种表面装饰和规格,因此能适合各种环境:从住宅到高档写字楼、从外部设施到豪华的水上项目、从工业建筑到医院。
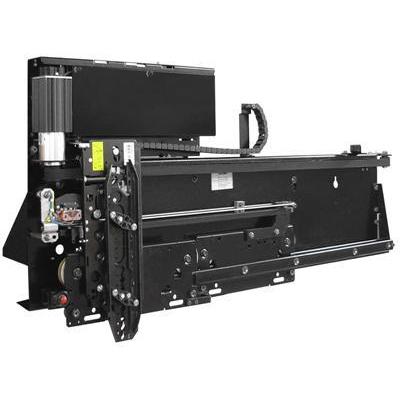 Since 1977 Wittur has been providing the lift industry with versatile and high-quality doors. More than 30 years later Wittur is the leading company in the lift doors segment, with state-of-the-art technical solutions and unparalleled product range. Regardless of whatever your lift requires - a round door with panoramic panels rather than a straight or a folding one - Wittur can supply the best solution for your needs.
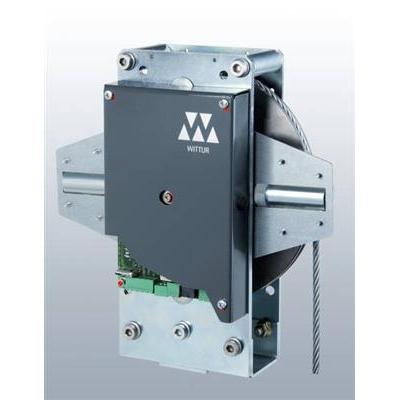
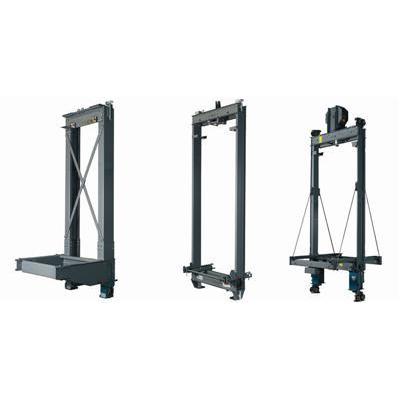 Wittur offers a wide range of car and counterweight frames. Modularly conceived, these components are very flexible in terms of rated load, height and width. The wide range of accessories includes safety gears, suspension pulleys, compensation chain and travelling cable hangers, allowing configurations suitable for different shaft layouts, lift designs and rated speeds. Wittur can also supply special frames for tailored projects.
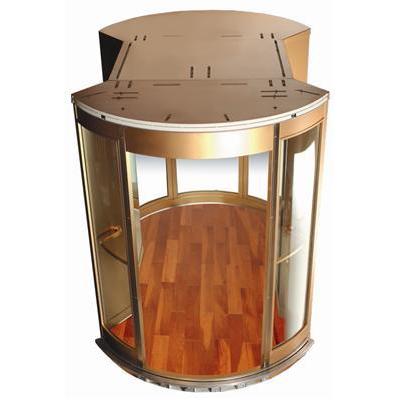
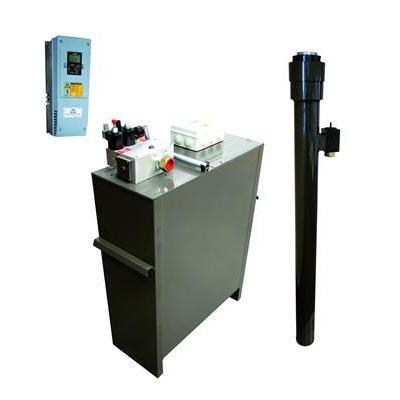
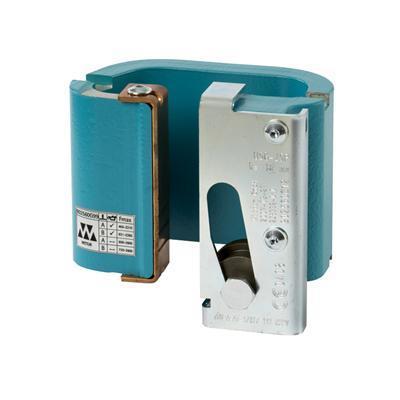 创新的解决方案研究和严格的产品质量控制是威特安全部件的主要特色。产品系列包括不定向/双向同步和渐进式安全钳。也可提供上升轿厢超速保护装置。
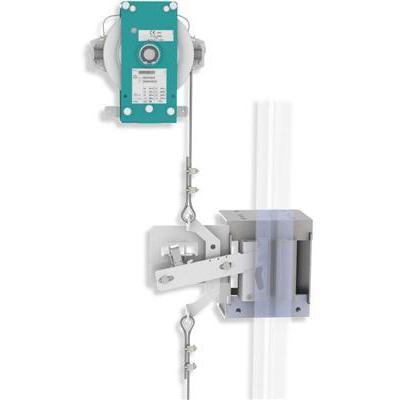 According to EN81-1/2 A3 and EN81-21 A1 (new lifts in existing buildings), new lifts installed after January 1st 2012 must be equipped with a system to prevent a car moving away from the floor with the landing door not in the locked position and the car door not in the closed position.
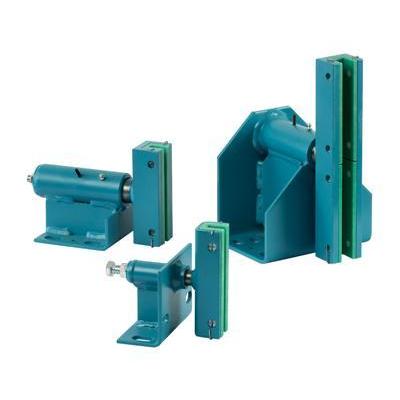 所有井道附件对于保证电梯的正常运行和使用寿命都是至关重要的。这正是威特提供以下各种附件的原因:
 Since 1977 Wittur supplies the lift industry with versatile and high-quality doors.
.jpg) Since 1977 Wittur supplies the lift industry with versatile and high-quality doors.
Since 1977 Wittur supplies the lift industry with versatile and high-quality doors.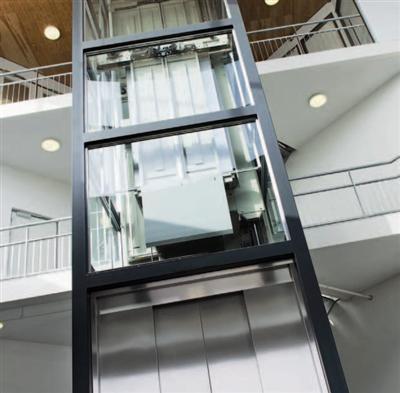 Since 1977 Wittur supplies the lift industry with versatile and high-quality doors.

2017
Annual Key Figures
Key performance indicators
The Group’s financial figures at a glance
The Group’s financial figures at a glance
| Wittur Group Consolidated1) | Wittur Group Consolidated1) | ||||
| 12M 2016 | 12M 2017 | Change | |||
| Revenue2) | EUR m | 697,8 | 776,8 | 11,3% | |
| by region | |||||
| Europe | EUR m | 363,4 | 420,8 | 15,8% | |
| Asia | EUR m | 274,5 | 286,5 | 4,4% | |
| Rest of World | EUR m | 59,8 | 69,4 | 16,0% | |
| Pro froma revenue growth at constant currency3) | % | n/a | 8,7% | ||
| Gross profit before depreciation4) | EUR m | 171,8 | 180,6 | 5,1% | |
| EBITDA Adjusted5) | EUR m | 97,8 | 106,7 | 9,0% | |
| EBITDA Adjusted5) margin | % | 14,0% | 13,7% | -0,3% | |
| EBIT6) | EUR m | -85,3 | 1,2 | -101,4% | |
| EBIT6) margin | % | -12,2% | 0,2% | 12,4% | |
| Profit or loss for the period7) | EUR m | -126,7 | -62,8 | -50,4% | |
| Net cash flow used in investing activities8) | EUR m | -13,8 | -8,7 | -37,2% | |
| Net cash flow before financing activities9) | EUR m | 40,4 | 67,7 | 67,4% | |
| Number of doors10) | number | 1.768.881 | 1.955.237 | 10,5% | |
| Employees11) | number | 4.358 | 4.486 | 2,9% | |
| 31.12.20161) | 31.12.20171) | Change | |||
| Total equity and liabilities12) | EUR m | 1.042,3 | 1.026,5 | -1,5% | |
| Equity12) | EUR m | 39,2 | -34,6 | -188,1% | |
| Equity ratio12) | % | 3,8% | -3,4% | -7,1% | |
| Wittur Group Net Financial Debt13) | EUR m | 649,7 | 636,5 | -2,0% | |
| (Pro forma) Wittur Group LTM EBITDA Adjusted14) | EUR m | 107,4 | 106,7 | -0,7% | |
| Ratio of Net Financial Debt to (pro forma) LTM EBITDA Adjusted15) | ratio | 6,05x | 5,97x | -0,08x | |
| 1) | Consolidated Wittur Group are consolidated accounts of Wittur International Holding Group including Sematic IFRS accounts as of 01.04.2016. | |
| 2) | Revenue: generated from the manufacture and provision of components, drives and systems for the elevator industry. This includes elevator components, such as automatic elevator doors, cabins, safety components, drives, elevator frames and complete elevators, used both in new installations and modernizations. | |
| 3) | Revenue growth excluding exchange rate effects. Prior year combined pro forma Wittur Group figures sum up Wittur Group standalone IFRS accounts and Sematic Group Italian GAAP standalone accounts for the period January 1, to March 31, 2016, and Sematic Group IFRS accounts from April 1, 2016 onwards, assuming that the Sematic acquisition occurred on January 1, 2016, so that Sematic standalone’s business operations are included as of January 1, 2016. | |
| 4) | Gross profit before depreciation: revenue less cost of sales which includes direct and indirect production costs attributable to the production process and relating to the products sold, including costs of materials, labor, freight, packaging and other costs, as well as income and costs resulting from changes in warranty provisions. Cost of sales excludes personnel costs for employees in research and development, selling and distribution and general and administration functions. | |
| 5) | EBITDA Adjusted: consolidated net result for the period adding back finance expense, finance income, income taxes and depreciation and amortization after adjusting for extraordinary income and expenses. | |
| 6) | EBIT: Consolidated net result for the period adding back finance expense, finance income and income taxes. | |
| 7) | Profit or loss for the period: consolidated net result for the period. | |
| 8) | Net cash flow used in investing activities: net cash flow from investing activities less purchase/sale of other investments less other investing cash flow. | |
| 9) | Net cash flow before financing activities: net cash flow from operating activities less net cash flow used in investing activities (see footnote 8). | |
| 10) | Number of doors: number of elevator doors (units), including door mechanisms sold in the period. | |
| 11) | Employees: headcount (full and part-time employees at the end of period). | |
| 12) | Equity as of 31.12.2016 and 31.12.2017 - Wittur Group consolidated accounts including Sematic | |
| 13) | Wittur Group Net Financial Debt: 3rd party short and long term borrowings including finance leases less cash and cash equivalents. 31.12.2016 and 31.12.2017 - Consolidated Wittur Group Net Financial Debt according to IFRS including Sematic. |
|
| 14) | (Pro forma) Wittur Group LTM EBITDA Adjusted: 31.12.2016 - Combined pro forma Wittur Group 12M IFRS EBITDA Adjusted, including Wittur Standalone EBITDA Adjusted plus Sematic Italian GAAP EBITDA Adjusted for the period January 1, 2016 to March 31, 2016 plus Sematic IFRS EBITDA Adjusted for the period April 1, 2016 to December 31,2016 and additional expected run-rate synergies from the Sematic acquisition of EUR 5.8m. 31.12.2017 - Wittur Group consolidated accounts including Sematic |
|
| 15) | Ratio of Wittur Group Net Financial Debt to (pro forma) Wittur Group LTM EBITDA Adjusted. | |